
The Nuance of Glycemic Index & Load
- Karli Klintworth

- Aug 28, 2025
- 4 min read
Continuous Glucose Monitors (CGM's) are all the rage these days for tracking your blood glucose levels in realtime. What if you don't want to spend the money and/or wear a monitor on your arm, but still want an idea of how foods might spike your blood glucose? Enter: the Glycemic Index (GI) and Glycemic Load (GL). What are they, what's the difference between the two, and are they helpful health indicators?
Both measures are used to assess how a specific food will affect our blood sugar (glucose) levels. Easy, right? But, as with anything in the health and nutrition space, there's a lot of nuance to the story to muddy the waters. Let's explore how GI & GL can be helpful tools to describe how food affects our bodies and the limitations of these tools.
Glycemic Index (GI)

How much does 50 g worth of digestible carbohydrates (accessible, or net carbs) in a given food raise our blood sugar levels over the course of a 2 hr period compared to a reference food (typically pure glucose (GI of 100). 50 g of digestible carbs may or may not be indicative of a reasonable portion size of that food. For example, a medium avocado has about 2 grams of net carbs (carbs minus fiber). You'd have to eat 25 avocados to have 50g of digestible carbs!
Glycemic Load (GL)

GL measures the number of digestible carbs in a "typical" serving of food - A much more useful measurement for going about daily life...if you can agree upon a "typical" serving size.
This is where personal interpretations vs collective/corporate consensus makes things messy. For example:
The Oreo company lists that 2 Double Stuf Oreos is a typical serving (see graphic below)
I think eating 3 in one sitting is a pretty realistic number
Many people say that 4 in one sitting is totally normal
That's a big discrepancy in "typical" serving sizes. Who is correct? It's all a matter of perspective.
GL takes into account more realistic portion sizes (or at leasts they should try to) which reflects the quantity of other macronutrients in a given food like fiber (indigestible carb), water, fat, & protein content - none of which have much impact on our blood sugar.
For example, watermelon has a high GI of around 76, but it has a very low GL of around 4. How can this be? Yes, the caloric content of watermelon is almost entirely sugar (mostly fructose), but it also contains so much water that the sugar per serving is actually quite low. You have to eat a lot of watermelon to get to the 50g of carbs that's used when testing the GI.
Here's how Glycemic Load (GL) is calculated - We'll use Double Stuf Oreos as an example:

(GI x (net carbs per serving))/100 = GL
The GI score for Double Stuf Oreos is about 70 - No official GI value for Double Stuf Oreos exists so we made an approximation based on a regular Oreo. Note that the package of Double Stuf Oreos lists 1 serving as 21g of digestible carbs (net carbs), not 50g. This means 2.38 servings, or 4.76 cookies, is used to calculate the GI score for Double Stuf Oreos.
(70 x (net carbs per serving)/100 = GL
Net Carbs = Total Carbs - Fiber → Fiber is an indigestible carbohydrate so it doesn't count
2 cookies is listed as the official serving size on the nutrition label for Double Stuf Oreos, so we'll use that to calculate net carbs per serving.
(70 x (21-0))/100 = 14.7
This gives us a GL value of 14.7 - which is firmly in the medium zone. Not terribly high.
However, the 4.76 cookies (50g) used to calculate the GI score is much closer to an actual serving size in real life than the 2 cookies used to get the official GL score....This is where that personal interpretation we mentioned earlier comes in.
To keep the math simple, we'll round to an even 4 cookies to get a more accurate GL for for most people.
(70 x (42-0)/100 = 29.4
Based on this much more realistic serving size, the GL of Double Stuf Oreos goes from medium to firmly in the red zone...definitely not good, but much more realistic.
Glycemic Load does a much better job than Glycemic Index at revealing the blood sugar response of a typical serving of a food. However, if your guestimation of a serving size of a food is off, looking up its GL may be very misleading.
Personal Variance
You can look up the GI or GL of nearly any food with carbohydrates. Yet that that only tells you the average blood glucose response of a large cohort of 'healthy' test subjects. There's a reasonable chance that you'll react in a similar manner, but that's not the case for everybody. Things like stress, gut health, hormonal balances (or imbalances), the order you eat your food, the time of day you eat your carbs, and more can all effect how you respond to a given carbohydrate. A CGM will help determine exactly how your blood sugar reacts to a given food.
Shape of the Curve Matters
GI and GL both address the Area Under the Curve (AUC) of your blood sugar response over two hours. All three of the examples below have the same AUC, but very different effects on our mood, hunger, energy levels, etc. What AUC doesn't tell you is how quickly blood sugar rises and falls or how high the blood sugar peak(s) were.
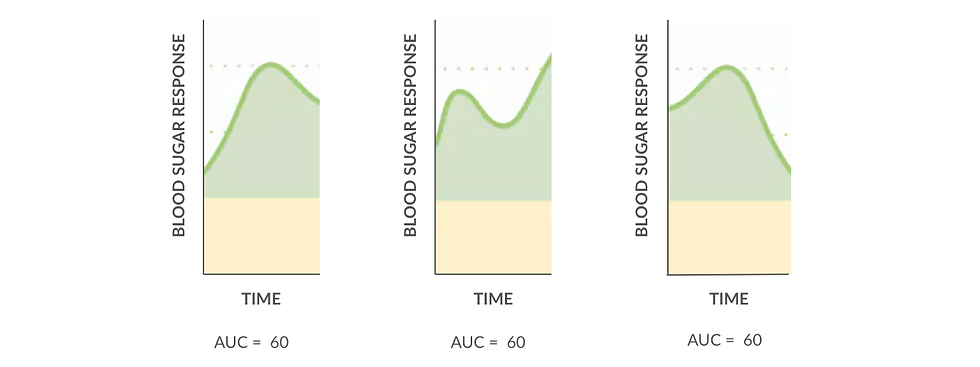
AUC is good information, but how you feel is often determined more by the speed of the blood sugar spike and corresponding drop - which is not reflected in GI or GL scores. Large sudden swings in blood sugar is what makes us feel bad - "hangry", tired, anxious, nauseous, shaky, sweaty, etc.
Glucose vs. Fructose
Pure glucose has a GI of 100. White rice has a GI of 74. Table sugar has a GI of 65. Huh? How is the GI of table sugar so low?
>>> STAY TUNED FOR MORE INFO <<<


Comments